New database tool can help you define and refine client outcomes >
Cross-posted from Microcredit Summit Campaign

When I joined Freedom from Hunger several years back, I had the responsibility to carry on a decades-long commitment to research and evaluation. My predecessor, Barbara MkNelly, as well as my then-supervisor and president of Freedom from Hunger, Christopher Dunford, were already known for their contributions to the research efforts of the growing microfinance sector and the original set of SEEP/AIMS client assessment tools. Freedom from Hunger’s commitment to promoting easy-to-use and cost-effective tools also led to years of developing monitoring and evaluation systems for microfinance organizations that were coined as “Progress Tracking.” Fast-forward several years, and this is much better known as Social Performance Management.
With Freedom from Hunger’s commitment to the integration of microfinance and health, we have invested our research efforts in developing, testing, and implementing low-cost sampling and analysis tools that have been used within our sector and the public health sector. These include Lot Quality Assurance Sampling and Knowledge, Practice and Coverage (KPC) surveys. We have also collaborated with the United States Department of Agriculture to adapt the US food security survey to our international context.
Our research portfolio includes hundreds of applications of these low-cost tools as well as large-scale randomized control trials and quasi-experimental designs. Most recently, in collaboration with the Microcredit Summit Campaign and Johnson & Johnson, we worked with several microfinance partners to select and test a short-list of health indicators, known as the health outcome performance indicators (HOPI), which could be used to track client progress over time. Our goal for the HOPI is to provide those MFIs whose mission includes health outcomes specifically or client well-being in general with a short list of tested indicators that they can track over time. They can adopt the HOPI in its entirety or they can add select indicators to their existing data collection system, as ESAF and Equitas are doing in India, for example.
We’ve learned through these experiences that one of the key obstacles for organizations in implementing and using client outcomes data is often conducting the data analysis. For many of us, this is not so much a lack of skill, as it is a lack of time to take our data and make it work for understanding our clients. For years, we’ve worked with our partners to implement the Progress out of Poverty Index® (PPI®) in their data collection practice, but given our focus on other outcomes, such as food security and health, we were always combining these indicators to help us better understand client vulnerability. Analyzing the data was often the log-jam to making the data work for us quickly.
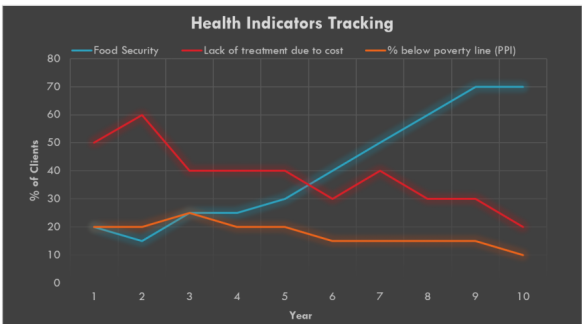
So, in a follow-on project to the development of HOPI and with the continued support of Johnson & Johnson, we worked with a consultant to design a client outcomes data collection and data analysis tool to help overcome this obstacle. We’ve named this tool the Client Outcome Performance (COPE) Indicators Database. This tool has lean data in mind. It is an MS Excel-based tool. It is built off an assumption that an MFI is collecting PPI data and has an interest in adding a few, strategic indicators to their data collection activities. Thus, an MFI can add up to 10 additional indicators to be analyzed by this tool. Plus, given we’ve found food security to be an important dimension of client well-being, we’ve already built one food security question into the tool.
We have also prepared a pre-filled COPE database with 10 questions taken from the HOPI that we have found to be the most useful and which have been field tested by MFIs in India, the Philippines, and Bolivia. You can download that database here.
The COPE Indicators Database allows the user to enter their 10 survey questions, their specific-country PPI survey, and then the data from those implemented surveys can be entered. Once the survey data is entered, the database will immediately conduct comparisons of the PPI data and the additional indicators. For example, if a key indicator of interest is whether clients treat their water, the tool will indicate what share of those living below the $1.25 international poverty line [1] treat or do not treat their water. This data becomes helpful in better understanding our clients who do or do not live below any given poverty line. The tool also allows the user to enter known national or regional benchmarks for better data usage.
So far, we’ve found this tool to be useful in making sense of our data in a shorter amount of time. Now, we invite you to see if the COPE Indicators Database can make your data analysis work for you as well. As the sector continues to define and refine client outcomes, through the efforts of working groups such as those supported by the Social Performance Task Force, we’re getting closer to demonstrating our commitment to evidence-based poverty alleviation. We’re hoping the COPE tool will be a part of making this commitment achievable.
You can find the COPE Indicators Database, instructions, and examples on both the Microcredit Summit Campaign and Freedom from Hunger websites.
[1] The World Bank has updated the $1.25 a day poverty line (2005 PPP) in 2015 to $1.90 a day (2011 PPP). You can see what this means for the PPI in this blog post from Julie Peachey at Grameen Foundation.


