Poverty Outreach Goals – What is the right one for my organization? >
This is a question that many PPI users grapple with. As an organization that serves the poor, what is the measurable metric related to reaching the poor that we must aim for? To paraphrase the well-known Goldilocks fairy tale – how do I ensure that it is neither too high, nor too low, but just right?
This first installment of the PPI Practitioner Guidance Series demonstrates how applying the PPI to your customer base and determining who you already serve before setting targets will generally ensure that your poverty goals are realistic.
Using Benchmarks
One approach to setting targets is to look at comparable benchmarks. Let’s say that you are an organization providing health services to low-income households in Guatemala. You observe that in 2014, 48.6% of Guatemalan households lived below the National Poverty Line.1 This implies that if you do not actively recruit the poor, but just make a random selection of Guatemalans to enroll into your program, you are likely to match this poverty rate.2 As an organization focused on serving the poor, you may therefore decide to aim for a portfolio poverty rate that exceeds this rate. The extent by which you should exceed this rate is a decision to make based on your organization’s mission and focus.
Let’s take this example further. Assume you exclusively serve households in the department of Sololá, which is considerably poorer than the rest of Guatemala. You note that in Sololá, as many as 71.3% households were below the National Poverty Line3 in 2014. You may then want to use this rate as a benchmark for yourself rather than the national average.
Understanding Your Existing Customer Base
Another approach is to actually understand who you are serving first, and then use that as a basis to set poverty goals. To do so, apply the PPI first either to your entire beneficiary base, or to a random and representative sample of your beneficiaries.
Let us take the example of Prisma, a Microfinance Institution based in Peru. When Prisma first piloted the PPI, it found that 36.55% of its customers were below the National Poverty Line. PPI results also revealed that Prisma’s poorest customers resided in rural areas, and that its female customers came from poorer households than men. Identifying women in rural areas as the target group which needed its services most, Prisma decided to rapidly expand its outreach to this group. It found that its Village banking program, which involves regular group meetings in these rural communities, worked best to reach and serve these women. Prisma therefore set a goal to expand the number of clients enrolled in its Village banking program from 46% to 70% over the next two years. So instead of setting a poverty goal in terms of the percentage of poor clients it would serve, Prisma used PPI data to set an objective goal for the program (Village banking) that would be a key driver to reach more poor customers. You can download the full Prisma case study here.
To take another example, a recent study on the Microfinance sector in four states in India conducted by Grameen Foundation India found that nearly one half of new customers recruited by participating microfinance institutions are in the segment between the $1.25/day and $2.50/day 2005 PPP poverty lines.
To compute the percentage of customers between any two poverty lines – for example, the $1.25/day and $2.50/day 2005 PPP lines - the total percentage of customers below the $1.25/day 2005 PPP line was subtracted from the total percentage of customers below the $2.50/day 2005 PPP line.
The study found that there is significant room for expansion of services to the “poorest of the poor” – the segment that lies below the $1.25/day 2005 PPP Poverty Line - in these states. The chart below extracted from the study (for the state of Madhya Pradesh), shows the customer base divided into 5 different segments:
- < NT (India’s National Poverty Line – the National Tendulkar Line)
- Between the NT and the $1.25/day 2005 PPP Poverty Line
- Between the $1.25/day and the $1.88/day 2005 PPP Poverty Line
- Between the $1.88/day and the $2.50/day 2005 PPP Poverty Line
- >$2.50/day 2005 PPP Poverty Line
The right-hand side4 indicates the size of each segment in terms of number of customers. So, for example, we see that 118,000 customers are between the $1.25/day and $1.88/day 2005 PPP Poverty Line, and that this segment accounts for 35% of total customers recruited. On the other hand, only 39,000, or 12%, of customers are below the NT Line. The study aims to provide a basis for stakeholders in India’s Microfinance Sector to strategize on whether MFIs should engage with this underserved segment, and if so, what measures can be taken to facilitate this.
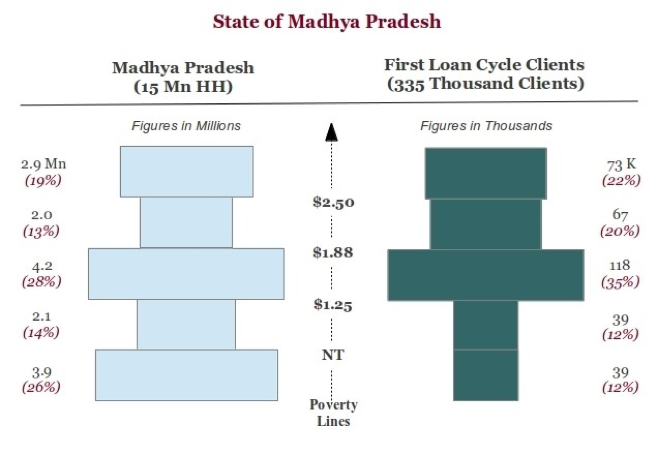
Source: Poverty Outreach of Microfinance in Four Indian States (2015), Grameen Foundation India
Creating a similar breakdown might be a great way for you to visualize your own customer base. You can first determine which poverty segments you are currently serving, and then set organizational goals. An exercise like this could generate surprises – you could be serving either more or fewer poor customers than you imagine.
Think in Terms of Annual Expenditure Levels
Sometimes, it may help to visualize your customer base in terms of annual expenditure levels. The design documentation that is released with every PPI provides the value of every poverty line that the PPI is calibrated to, in local currency units. For example, in the case of the 2014 Guatemala PPI, the National Poverty Line is 28.05 Guatemalan Quetzals in per-capita expenditure per day.5 If a household has a 20% probability of being below this National Poverty Line in Guatemala, it means that the household has a 20% probability of having per-capita expenditure below 28.05 Guatemalan Quetzals per day. Multiplying this per-capita expenditure figure by the appropriate inflation index, average household size, and number of days in a year gives you an annual household expenditure figure. If you further wish to report consumption expenditures in nominal prices, you should reverse the spatial adjustment so that expenditures are in the actual currency of the relevant area. You can then think of this household as having a 20% probability of having an annual household expenditure below that level.
For an example of how this can be done, refer to this case study on the Microfinance sector in the state of Karnataka in India.6 Here, the $1.25/day 2005 PPP Poverty Line works out to an annual household expenditure of 58,500 Indian Rupees in rural India. Hence, if an organization determines that 30% of its customer households in rural India are below the $1.25/day 2005 PPP line, it means that 30% of its customer households have an annual household expenditure below 58,500 Indian Rupees.
Conversely, 70% of the organization’s customer households have an annual expenditure above 58,500 Indian Rupees. Note, however, that we do not know the exact annual expenditure amounts. It is also not possible to estimate the fraction of households with an annual expenditure close to this limit.
It is often more intuitive for organizations to define the poverty segments that they serve in this way. Analyzing annual household expenditure estimates in this manner can also offer business insights to social enterprises. For example, it can help a healthcare provider understand the ability of its beneficiaries to bear out-of-pocket expenses in an emergency. For a financial services provider, this information can help contribute to decisions on pricing products appropriately for clients.
More Realistic Goals
Applying the PPI to your customer base and determining who you already serve before setting targets will generally ensure that your goals are more realistic. Knowing where you stand will make it easier to determine where you can get to, given the resources at your disposal. Of course, this is not the only approach to setting goals. It will, however, ensure that you neither set the bar so high that it is impossible to reach, nor so low that it does not challenge you at all. It may help to keep this in mind when your next annual planning exercise kicks off.
[1] Refer to Table 1 on Page 146 of the 2014 Guatemala PPI’s Design Documentation Memo, available at www.povertyindex.org/country/guatemala
[2] This is assuming that your selection is from a nationally representative set of clients, like those surveyed in the 2014 ENCOVI Survey, upon which the current Guatemala PPI is based.
[3] Refer to Table 2 on Page 170 of the 2014 Guatemala PPI’s Design Documentation Memo, available at www.povertyindex.org/country/guatemala
[4] These figures are as of September 2015, and were obtained by estimating the total number of first loan cycle clients of the 10 Microfinance Institutions participating in the study.
[5] Refer to Table 1 on Page 146 of the 2014 Guatemala PPI’s Design Documentation Memo, available at www.povertyindex.org/country/guatemala. Poverty lines are in daily per-capita GTQ in average prices during the ENCOVI fieldwork.
[6] Refer to Table 1 on Page 13 of this case study. This table expresses the poverty lines that India’s PPI is calibrated to in terms of annual household expenditure in Indian Rupees.