
Poverty Rates vs. Poverty Likelihoods >
When using the PPI and reporting its results, it’s helpful to understand the difference between the terms poverty likelihood and poverty rate—sometimes referred to as estimated poverty. These terms are not interchangeable and express different concepts, so it is important to use them correctly.
A poverty likelihood is the probability that an individual household’s expenditure level falls below a poverty line. For example. a poverty likelihood of 30% reflects a three-in-ten chance that a household is poor. Since this is a probability, one cannot say with certainty that an individual household is below a poverty line, though confidence increases the nearer the poverty likelihood is to 100 since this means the odds of a household being below a poverty line are much higher.
Users determine poverty likelihoods at the household level by cross-referencing a household’s PPI Score in the PPI Look-up Table. (Remember: never use a PPI score for data analysis.) The poverty likelihoods listed in the PPI Look-up Table are derived from the underlying dataset used to create the PPI; they represent the actual percentages of households whose expenditure levels fell below a poverty line for the varying score ranges. Since the underlying dataset is representative of the entire country, the likelihood can be interpreted as the probability that a household picked at random within the score range will fall below a particular poverty line in that country.
A poverty rate is for a group of households. It is an estimate of the actual poverty rate for the group. For example, if the poverty rate of a group of 1,000 households is 64%, an organization should assume that there are 640 households in the group that are below a poverty line. A poverty rate essentially allows an organization to accurately estimate the number of households below a poverty line. However, the PPI cannot tell you which households are actually poor.
Users determine poverty rates of groups by averaging the poverty likelihoods of all of the households (not their PPI scores). A poverty rate derived with the PPI may be used with a high degree of confidence in decision making.
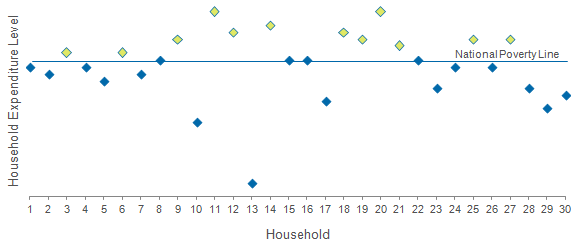
Why do poverty rates provide a higher degree of confidence than poverty likelihoods? Pretend that during a recent PPI data collection, there were 30 households with the same PPI score and the score correlates to a 60% likelihood of living at or below the national poverty line. Pretend further that we were able to determine each household’s actual expenditure level. These expenditure levels are plotted on the graph below. Even though the households’ actual expenditures vary widely, we see that 60% of the households do live at or below the poverty line.
Now, think about how the PPI is used in real life, without knowledge of actual household expenditure. A single household may have a 60% likelihood of living at or below a poverty line, but its actual expenditure level could be above the line. With any poverty likelihood, some households will be at or below the poverty line and others will be above it. One cannot say with absolute certainty whether a randomly selected household is poor or not based on PPI data alone. However, in a group of households that share a poverty likelihood of 60% (or for that matter that have likelihood values that average to 60%), we can confidently estimate that six out of ten households will live below the poverty line.
The table below summarizes the differences between poverty likelihoods and poverty rates:
| Individual or Group | Confidence | Source | Other Terms | Use in Analysis | |
| Poverty Likelihood | individual household | low | Poverty Look-up Table | poverty probability | targeting* |
| Poverty Rate | group | very high | average of poverty likelihoods | estimated poverty, poverty incidence, concetration of poverty | measuring poverty outreach, benchmarking, tracking poverty movement, evaluating products and services |
* Since poverty likelihoods have weaker correlation to poverty at the household level, use caution when using the PPI to target clients or customers. PPI Scores may also be used in targeting.


Comments